


Dear Editor,
It was not my intention to engage Dr. Ramesh Gampat in a debate out of pure respect for his outstanding scholarship and contribution to critical topical issues of national importance, through his academic work over the years. However, based on his latest response to a genuine question I raised, I am now inclined to address some of his contentions. To this end, reference is made to his letter in the Stabroek News edition of July 19, 2023, with the caption: “Ratings by World Bank, WER show Guyana’s statistical systems and the data they produce are appallingly dismal”.
Dr. Rampat has now shifted his argument from questioning the credibility of data produced by certain agencies in Guyana, to data quality. Let me state categorically that data credibility and data quality, in this context, are not the same. And it is crucially important that your readers understand the difference. To substantiate his argument, he referenced the World Bank’s Statistical Performance Indicators (SPI), but, inadvertently misrepresented, and arguably misinterpreted this index.
First, let me address a few issues he raised in his letter of July 15th, 2023, in response to this author, before I present my contentions on the World Bank’s SPI index. The distinguished scholar wrote: “from 1992 -1997, non-oil output by an average of 7.3%, a performance not repeated ever since. Over the entire 23 years that JB (referring to the undersigned) considered, real GDP grew by 3.4% and not 4%. The country’s external debt stock fell from 512.2% of GDP to 76.1%, and not from 900% to 40%”.
Here is what he was responding to, in his attempt to discredit my numbers and argument altogether from one of my articles, and I quote verbatim what was written:
“Guyana was once a centrally command State where more than 80% of the productive sectors were controlled by the State. In the post 1992 era, Guyana transitioned from a centrally command and bankrupt State to a mixed- economic system with more predominant features of a free market economy. Guyana’s debt-to-GDP stood at over 900% at one point in time. During this period, Guyana recorded the highest inflation rate of 89.7% in 1989, the highest interest rate (prime lending rate for the period) of 37.5% in 1989, negative growth rates were recorded in 1988-1990…”
Of note, I did not state that the debt-to-GDP was 900% in 1992. According to my data, which was sourced from the Ministry of Finance, the debt-to-GDP in 1992 stood at 588% and not 512.2% according to Dr. Rampat’s data. By 2014, the total stock of public debt stood at G$329.5 billion and non-oil GDP stood at G$874.6 billion, giving rise to a debt-to-GDP ratio of 37.67% to be exact, and not 76.1%, according to Dr. Rampat’s data. Again, the source of my data can be verified from the appendix of Bank of Guyana Annual reports. It is worth noting, as well, that the historic dataset that I have from 1985, these are data I gathered from research activities extracted from various budget speeches, estimates and Bank of Guyana reports at the Bank of Guyana library. Dr. Rampat may need to re-check his dataset and his sources given the disparity. Additionally, GDP in 1992 stood at US$374 million (G$46.74 billion) to be exact, thus could never grew by only 3.6% from 1992 to 2014, according to Dr. Rampat. The 4% growth in 2014 cited by this author was not from 1992-2014; that was actually the y-o-y growth rate from 2013-2014.
Now that I’ve dealt with the data disparities between this author’s and Dr. Rampat’s, I think he needs to clarify whether his dataset was obtained from online sources only; or whether he went physically to the Bank of Guyana library or the Ministry of Finance to obtain historical data. And if so, maybe he needs to verify his dataset, which I also did with mine.
The World Bank SPI Index
The issues raised by Dr. Rampat in his July 19th letter on data quality are not without merit. And it is not that the Administration of the day is denying that those concerns in relation to data quality are not valid. Notwithstanding, the distinguished professor failed to recognize that it will take considerable investment to improve overall data quality―because the entire institutional framework of the public sector needs overhaul apart from training and capacity building. Modern technology is the solution; hence the government’s ICT transformation agenda, I am positive, will address these issues. This is a long-term development which has to be done incrementally, considering that we do not have the capacity and the bandwidth to undertake a radical change of this nature.
Dr. Rampat asserts that the SPI allocates a score from 1 to 100. He goes onto to state that “of the 174 countries assessed for 2019, Guyana scores 41.5, which places it at 22 from the bottom. Norway is at the top with a score of 90.1 on the SPI. Of the 174 countries rated in 2017, Guyana’s SPI was 31.7, which placed it at the 12 position from the bottom. That is, the quality of Guyana’s statistical systems find a place in the bottom of the SPI quintile of the 174 countries rated in both years. These two abject ratings are two reasons to question the quality of data produced”.
Dr. Rampat is not entirely correct in his interpretation of the aforementioned SPI framework, developed by the World Bank. The framework constitute five pillars, which he correctly mentioned: (1) data use, (2) data service, (3) data products, (4) data sources, and (5) data infrastructure. The 41.4 score that Guyana obtained is the weighted average of each pillar. Each pillar is scored out of 100, and a score is allocated for each pillar. This can be verified here https://www.worldbank.org/en/programs/statistical-performance-indicators/explore-data.
For pillar (1) data use, Guyana scored 60/100, pillar (2) data service, Guyana scored 57/100, pillar (3) data products, Guyana scored 46/100, pillar (4) data sources, Guyana scored 19/100 and pillar (5) data infrastructure, Guyana scored 25/100, giving rise to a weighted average of 41.4 out of 100.
The diagram attached illustrates the pillars and dimensions that construct the SPI framework: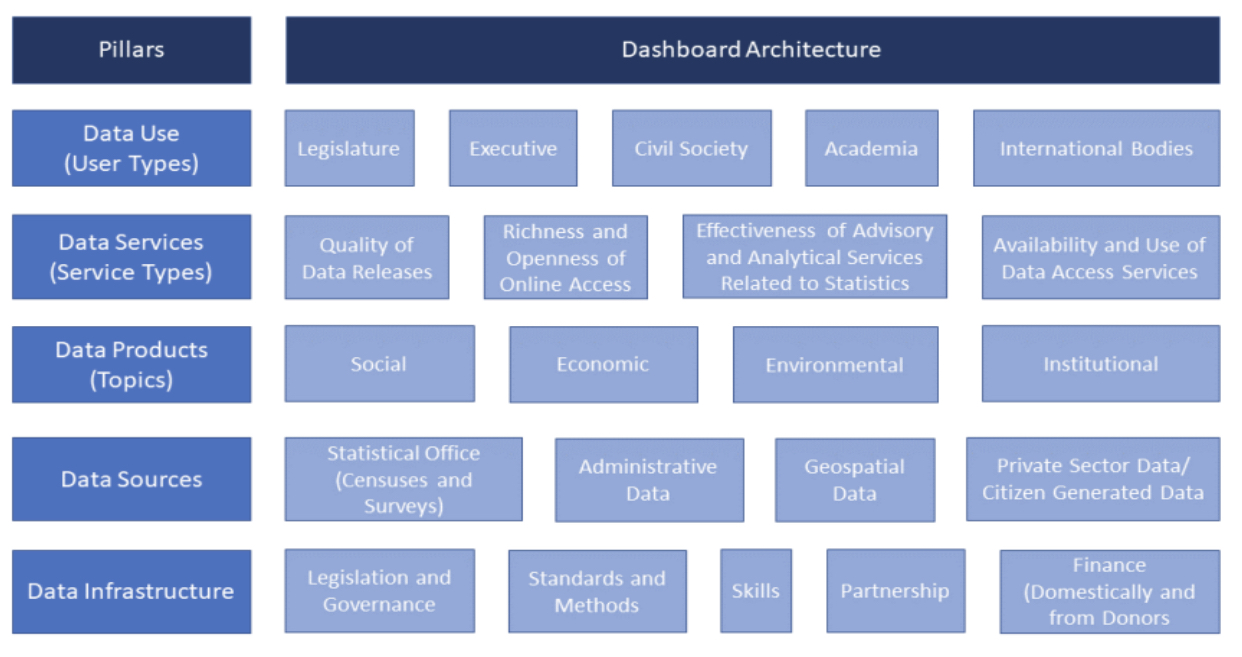
Hereunder stated are the explanations for each pillar, according to the World Bank.
Pillar 1: Data Use
The data use (outcome) pillar is segmented by five types of users: (i) the legislature, (ii) the executive branch, (iii) civil society (including sub-national actors), (iv) academia and (v) international bodies. Each dimension would have associated indicators to measure performance. A mature system would score well across all dimensions whereas a less mature one would have weaker scores along certain dimensions. The gaps would give insights into prioritization among user groups and help answer questions as to why the existing services are not resulting in higher use of national statistics in a particular segment.
Pillar 2: Data Services
The data services (output) pillar is segmented by four service types: (i) the quality of data releases, (ii) the richness and openness of online access, (iii) the effectiveness of advisory and analytical services related to statistics, and (iv) the availability and use of data access services such as secure microdata access. Advisory and analytical services might incorporate elements related to data stewardship services including input to national data strategies, advice on data ethics and calling out misuse of data in accordance with the Fundamental Principles of Official Statistics.
Pillar 3: Data Products
The data products (internal process) pillar is segmented by four topics and organized into (i) social, (ii) economic, (iii) environmental, and (iv) institutional dimensions using the typology of the Sustainable Development Goals (SDGs). This approach anchors the national statistical system’s performance around the essential data required to support the achievement of the 2030 global goals, and enables comparisons across countries so that a global view can be generated while enabling country specific emphasis to reflect the user needs of that country.
Pillar 4: Data Sources
The data sources (input) pillar is segmented by four types of sources generated by (i) the statistical office (censuses and surveys), and sources accessed from elsewhere such as (ii) administrative data, (iii) geospatial data, and (iv) private sector data and citizen generated data. The appropriate balance between these source types will vary depending on a country’s institutional setting and the maturity of its statistical system. High scores should reflect the extent to which the sources being utilized enable the necessary statistical indicators to be generated. For example, a low score on environment statistics (in the data production pillar) may reflect a lack of use of (and low score for) geospatial data (in the data sources pillar). This type of linkage is inherent in the data cycle approach and can help highlight areas for investment required if country needs are to be met.
Pillar 5: Data Infrastructure
The data infrastructure (capability) pillar includes hard and soft infrastructure segments, itemizing essential cross cutting requirements for an effective statistical system. The segments are: (i) legislation and governance covering the existence of laws and a functioning institutional framework for the statistical system; (ii) standards and methods addressing compliance with recognized frameworks and concepts; (iii) skills including level of skills within the statistical system and among users (statistical literacy); (iv) partnerships reflecting the need for the statistical system to be inclusive and coherent; and (v) finance mobilized both domestically and from donors.
Concluding Remarks
Against the aforementioned background, it is safe to conclude that the weighted average SPI score assigned to Guyana―does not necessarily renders the integrity and credibility of the current datasets produced by the various agencies, questionable. The data credibility/integrity and data quality in this context are not the same. Data credibility speaks to the authenticity of the data. While I agree that anomalies among agencies do exist, it is the materiality of those anomalies that would underpin the integrity of the data. If the anomalies are material enough, then the credibility of the data will be impacted, and if it is immaterial, then the credibility will not be adversely impacted.
Finally, from my experience, which ranges from dealing with datasets from working in the banking sector, the central bank, the private sector associations, and my involvement in active research activities, the anomalies I encountered are not material enough, and therefore, there is no impact on the credibility/authenticity/integrity of the dataset produced by the various agencies.
Yours respectfully,
Joel Bhagwandin


