


Dear Editor,
In parts Two, Three and Four of the series of op-ed articles by Ret’d Rear Admiral Dr. Gary Best, (hereinafter “the author”), he contends that…” the budget is not geared to reduce poverty or income inequalities, nor increase wages or salaries, or better health care.”
He claims also that the budget focuses on cost rather than adding value, that the gas-to-energy (GTE) project will not benefit Guyanese except the PPP class, that the economic policies increases income inequality, increases poverty, and restrict capital to the elite.
Again, as established in part I by this author, the forenamed author failed to provide a singular piece of empirical evidence, let alone analysis to substantiate all of the aforementioned assertions. This article seeks to address the author’s unsubstantiated argumentations empirically hereunder.
Poverty, and Poverty Reduction
In 1992, when the PPP/C administration assumed the reins of government as a democratically elected government―for first time since post-independence history, the economy inherited was in a bankrupt state. Citing the World Bank’s poverty reduction strategy paper for Guyana, it was noted therein that PAHO estimated that at least 50% of the population earned less than 55% of the mean income in 1971.
Based on this distribution of income, it was estimated that approximately 38% of the population in 1971 fell below the poverty line. Boyd estimated that the poverty level had risen to 65% of the population in 1988, and by 1989, taking into account the rapid worsening of inflation (a high of 87% inflation), that 75% of the population had incomes below the poverty line. The Ramprakash study in 1991 calculated that if receiving official nutritional requirements was the underlying criterion, an estimated 86% of the population would fall under the poverty line.
In a flawed and plagiarized 2022 fact sheet (established by this author), the World Bank had estimated that based on the upper middle income poverty line of US$5.5 per day, that 48% of the population are below the poverty line. Of interest to note, the World Bank removed the flawed fact sheet, which opposition elements rely on to propagate their political narratives. The mere fact that the Bank removed this report from their website, is evidenced that the Bank acknowledged the flaws and limitations that were subsequently analytically exposed by this author, which was brought to the attention of bank’s authorities at their local office.
Be that as it may, for the purpose of demonstration, by the World Bank’s benchmark, the Bank’s estimate is woefully inaccurate on multiple fronts. Using their poverty line of US$5.5 per day, equating to US$165 per month. The minimum wage in Guyana is equivalent to US$286 per month/person, and the average income per person, not the per capita income metric, but the average income based on an empirical analysis conducted by this author utilizing personal income tax data, is equivalent to US$500 per month/person after taking into account the labour force participation rate (49-50%). Thus, the minimum wage is 1.7x higher than the World Bank poverty line attributed to Guyana, and the average income per person is 3x higher than the World Bank’s poverty line attributable to Guyana.
Bear in mind that, it is a well-established fact that an unskilled laborer in the construction industry earns at least US$25 per day, and a skilled laborer earns at least US$50 per day. Consequently, the percentage of the population below the poverty line in Guyana cannot be 48%. Moreover, it should be noted that the working age population (Guyana Labour Force Study (GLFS), 2017) accounts for about 70% of the total population, with a labour force participation rate of 49% in 2017. Hence, a realistic estimate is more likely to be below 20-25% of the population.
Suffice it to state, aside from the World Bank’s poverty line benchmark based on income, another more broad-based empirical measure to determine whether poverty in Guyana has been increasing or decreasing, would be to empirically estimate and measure households “Net Wealth” (NW). Such an empirical analysis (utilizing financial sector data and income tax data to compute the estimated net household income for the period 1990-2023) was recently performed by this author.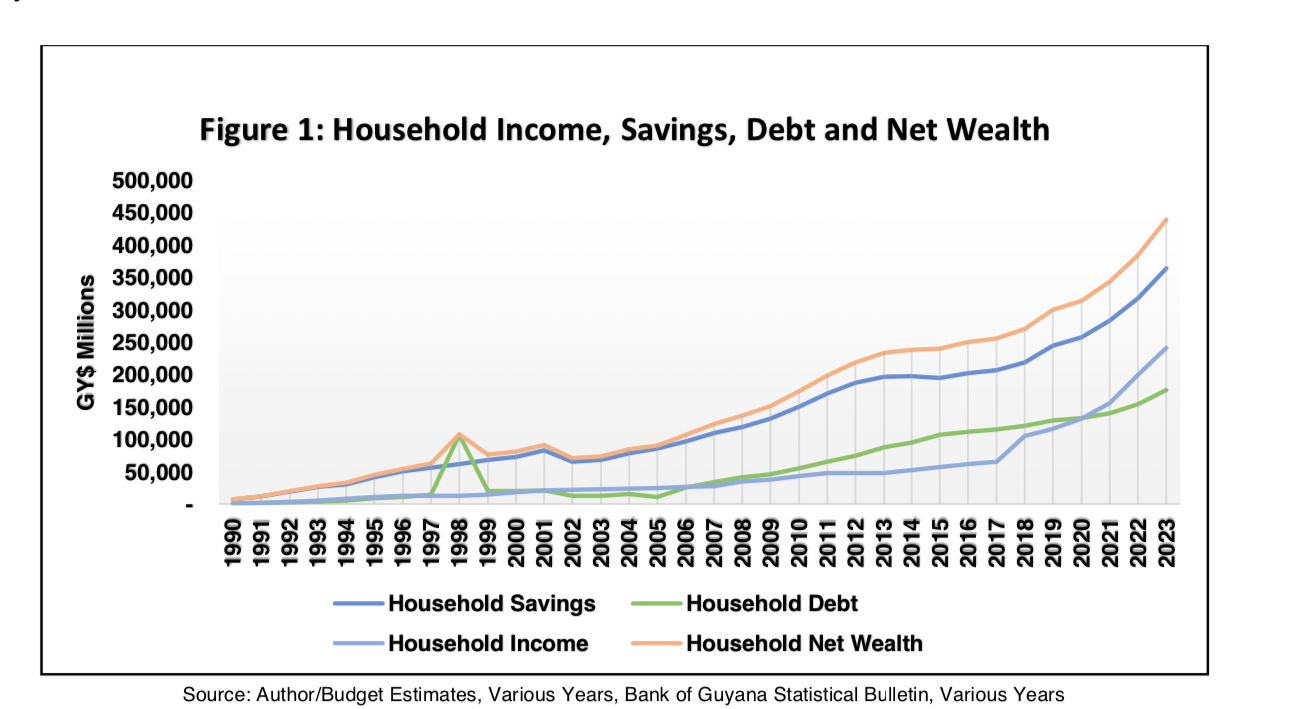
Towards this end (fig.1 attached), over the last three decades, households net income have actually grown by 303x since 1990 to reach an estimated $300 billion in 2023, representing 8% of GDP (24% of non-oil GDP); households savings have grown by 54x to reach $364 billion in 2023, representing 9.3% of GDP (30% of non-oil GDP); households debt have grown by 154x to reach $176 billion, representing 4.5% of GDP (14% of non-oil GDP); while households Net Wealth increased by 61x since 1990 to reach an estimated $500 billion in 2023, representing 13% of GDP (40% of non-oil GDP).
Total households net wealth was greater than the net assets for business enterprises (1.6x) which is an estimated $309 billion at the end of 2023, consistent with households net income which represents 105% of business enterprises net profits for 2023.
Interestingly, for the same period (1990-2023) overall GDP grew by 249x, reflecting a slower pace of growth in contrast to household income which grew by 303x, thereby outpacing the rate of growth in overall GDP. The increase in household net wealth is directly attributed to the PPP/C Government’s economic policies, for example, especially those such as the housing programme, and low-cost financing.
Turning to income inequality, this is typically measured by the Gini coefficient, where 0 is an indication of perfect equality and 1 is an indication of maximum inequality. A recent inequality study was done by a Guyanese scholar, Collin Constantine (2022).
Notwithstanding, the Gini coefficient has a number of limitations, where for example it does not take into account the determinants of income and other economic conditions. For example, the determinant of income is a function of the market dynamics. This includes the level of revenue generated by firms, the total employment costs relative to revenue considering industry specific factors as well as firm specific factors from a performance point of view. Additionally, an individual’s earning capacity is relative to their level of skills, competence, experience, education, output, and overall performance.
Furthermore, the Gini coefficient does not account for the fact that according to the GLFS study, less than 5% of the labour force possess a tertiary level education. This explains the large skills deficit and skills mismatch that currently permeate the labour market, thereby posing a major challenge to both the public sector and private sector firms. This, in turn, have a bearing on overall productivity and productive output in the economy.
It is for these reasons that the Government having recognized these challenges, is investing heavily in the human resources development. For example, technical and vocational training, the scholarship programme targeting some 30,000 persons, and their commitment towards making tertiary education free by 2025. These are the types of policies and investments that will improve income.
Against these backgrounds, the burden remains upon the forenamed author to prove that poverty is on the rise coupled with his other unsubstantiated claims, by robustly disproving the empirical analysis presented herein, with alternative academic evidence.
Yours respectfully,
Joel Bhagwandin


